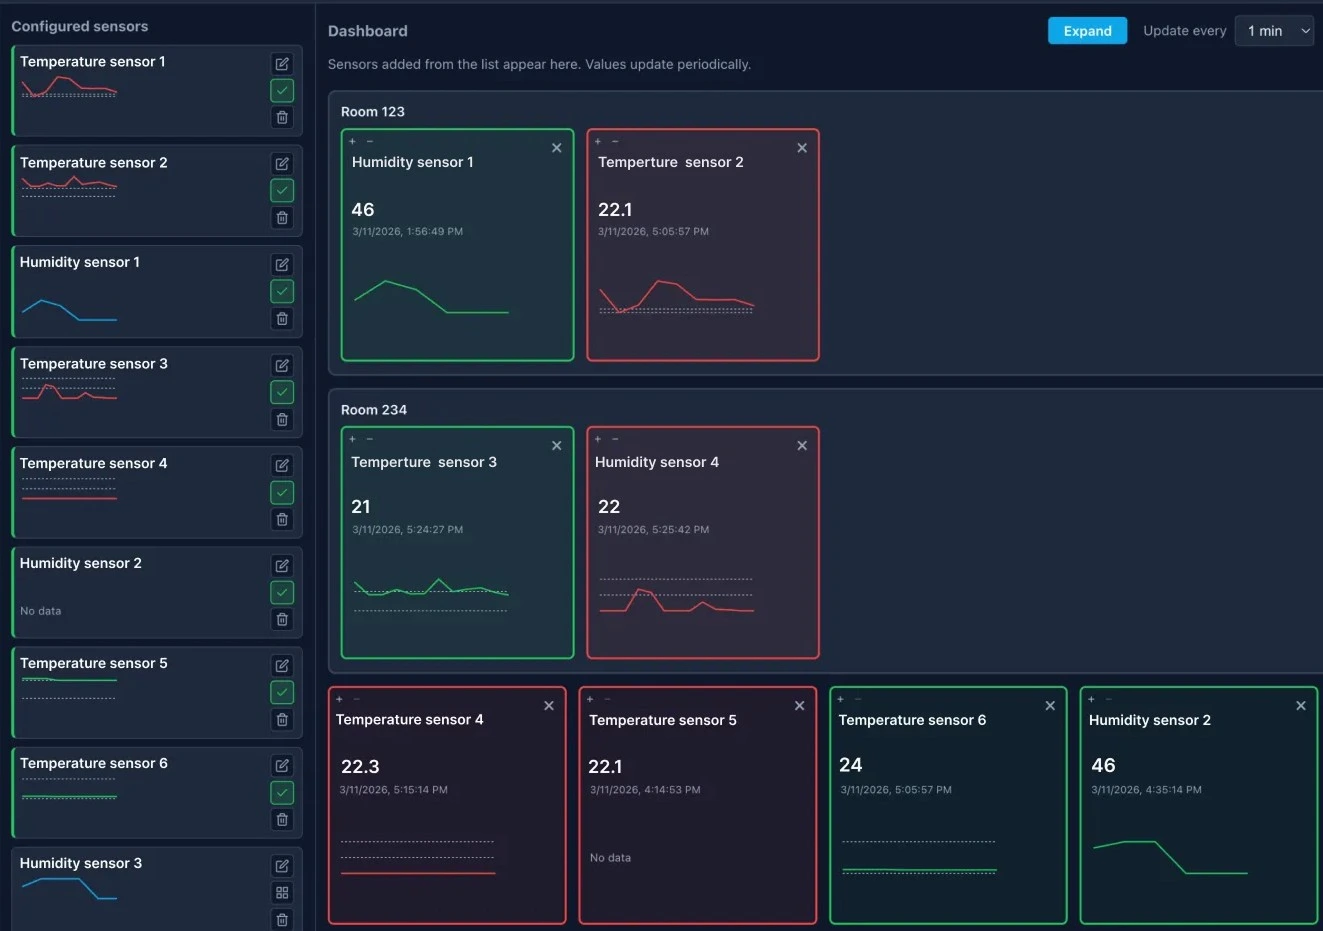
Sensoriqua helps teams monitor environmental and equipment conditions by physical zone rather than by tracker or sensor ID. Group temperature, humidity, equipment, and other sensor readings into rooms, storage areas, server zones, or production spaces, then set individual thresholds and scaling factors for each sensor.
- The live dashboard shows current zone status with clear color coding, helping operators quickly identify readings outside the configured range.
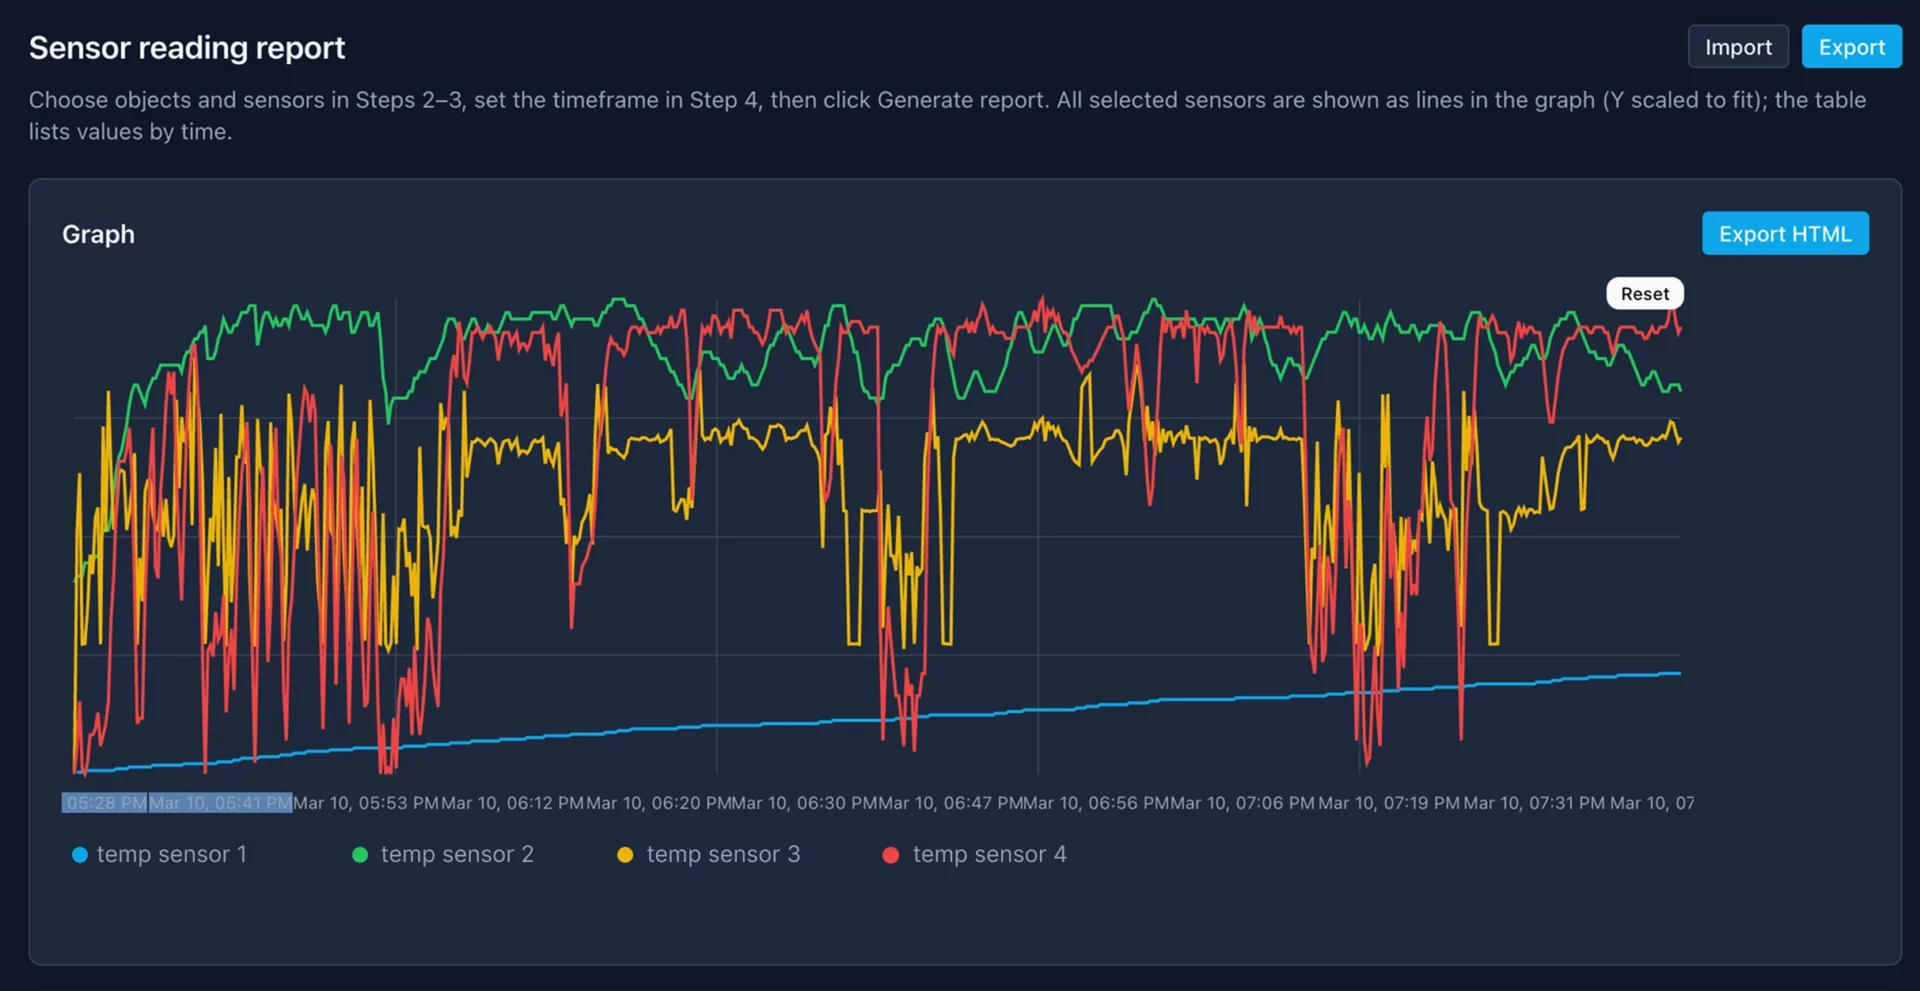
- Users can review historical sensor data, compare readings against threshold bands, analyze daily minimum, maximum, and average values, and export reports in PDF, XLSX, HTML, or JSON formats.
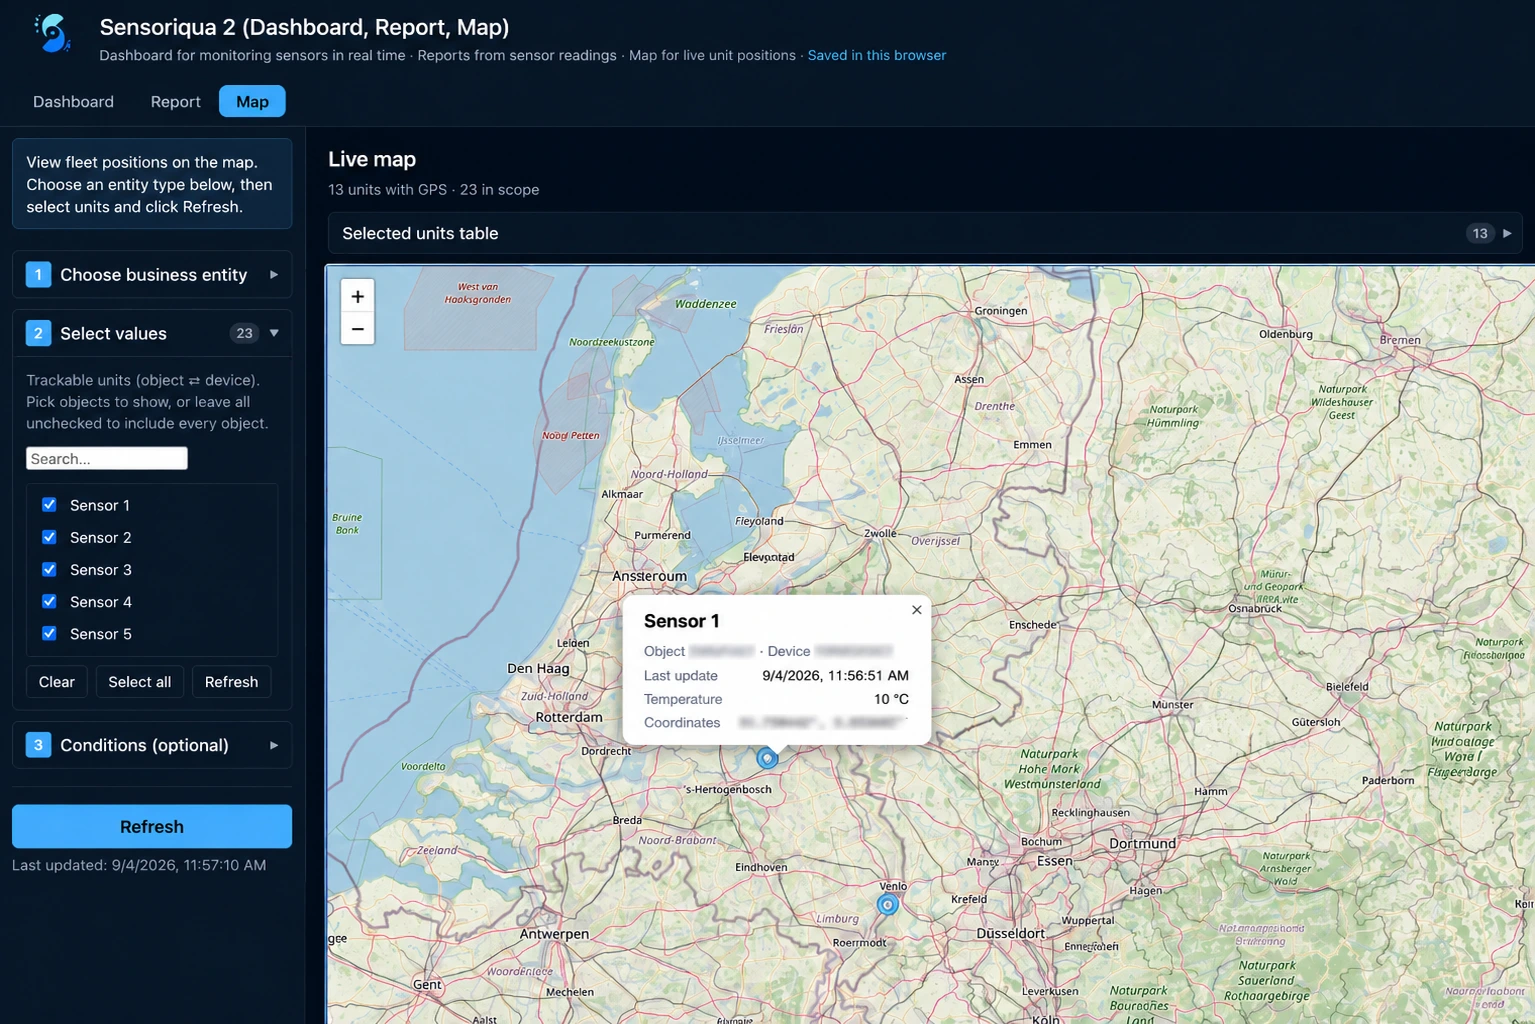
- A map view adds geographic context and helps locate monitored sites with out-of-range readings.